Reports
Open a ready-made report, change its dates, figures and filters, export it, and save, rename and delete reports of your own.
The reports list
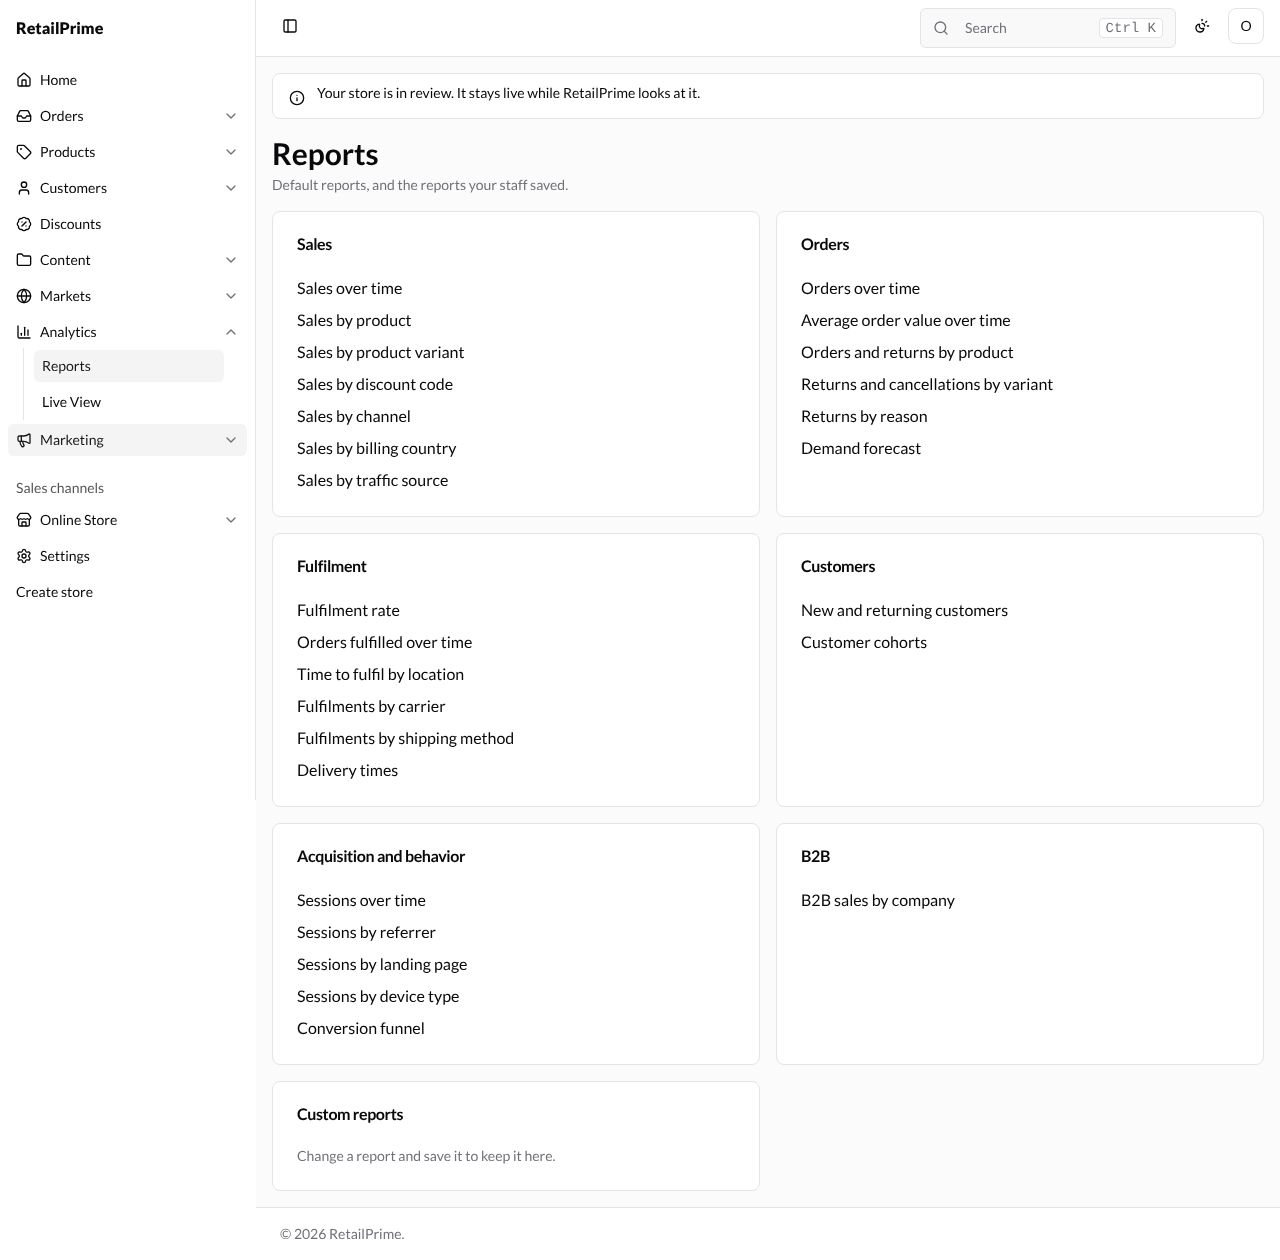
In the sidebar, press Analytics, then Reports. The page says Default reports, and the reports your staff saved. The ready-made reports are grouped in cards:
| Card | Reports |
|---|---|
| Sales | Sales over time, Sales by product, Sales by product variant, Sales by discount code, Sales by channel, Sales by billing country, Sales by traffic source |
| Orders | Orders over time, Average order value over time, Orders and returns by product, Returns and cancellations by variant, Returns by reason, Demand forecast |
| Fulfilment | Fulfilment rate, Orders fulfilled over time, Time to fulfil by location, Fulfilments by carrier, Fulfilments by shipping method, Delivery times |
| Customers | New and returning customers, Customer cohorts |
| Acquisition and behavior | Sessions over time, Sessions by referrer, Sessions by landing page, Sessions by device type, Conversion funnel |
| B2B | B2B sales by company |
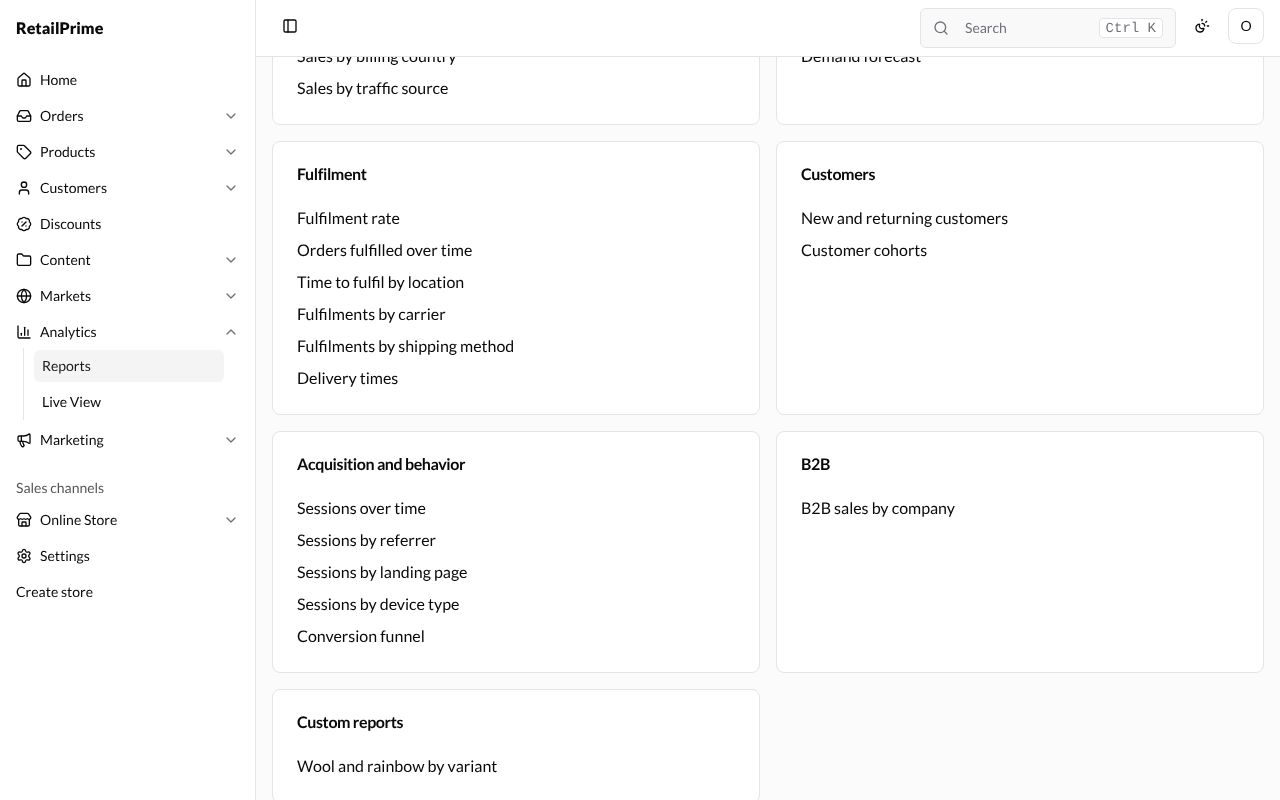
The last card, Custom reports, lists the reports you saved. At first it says Change a report and save it to keep it here.
Open a report
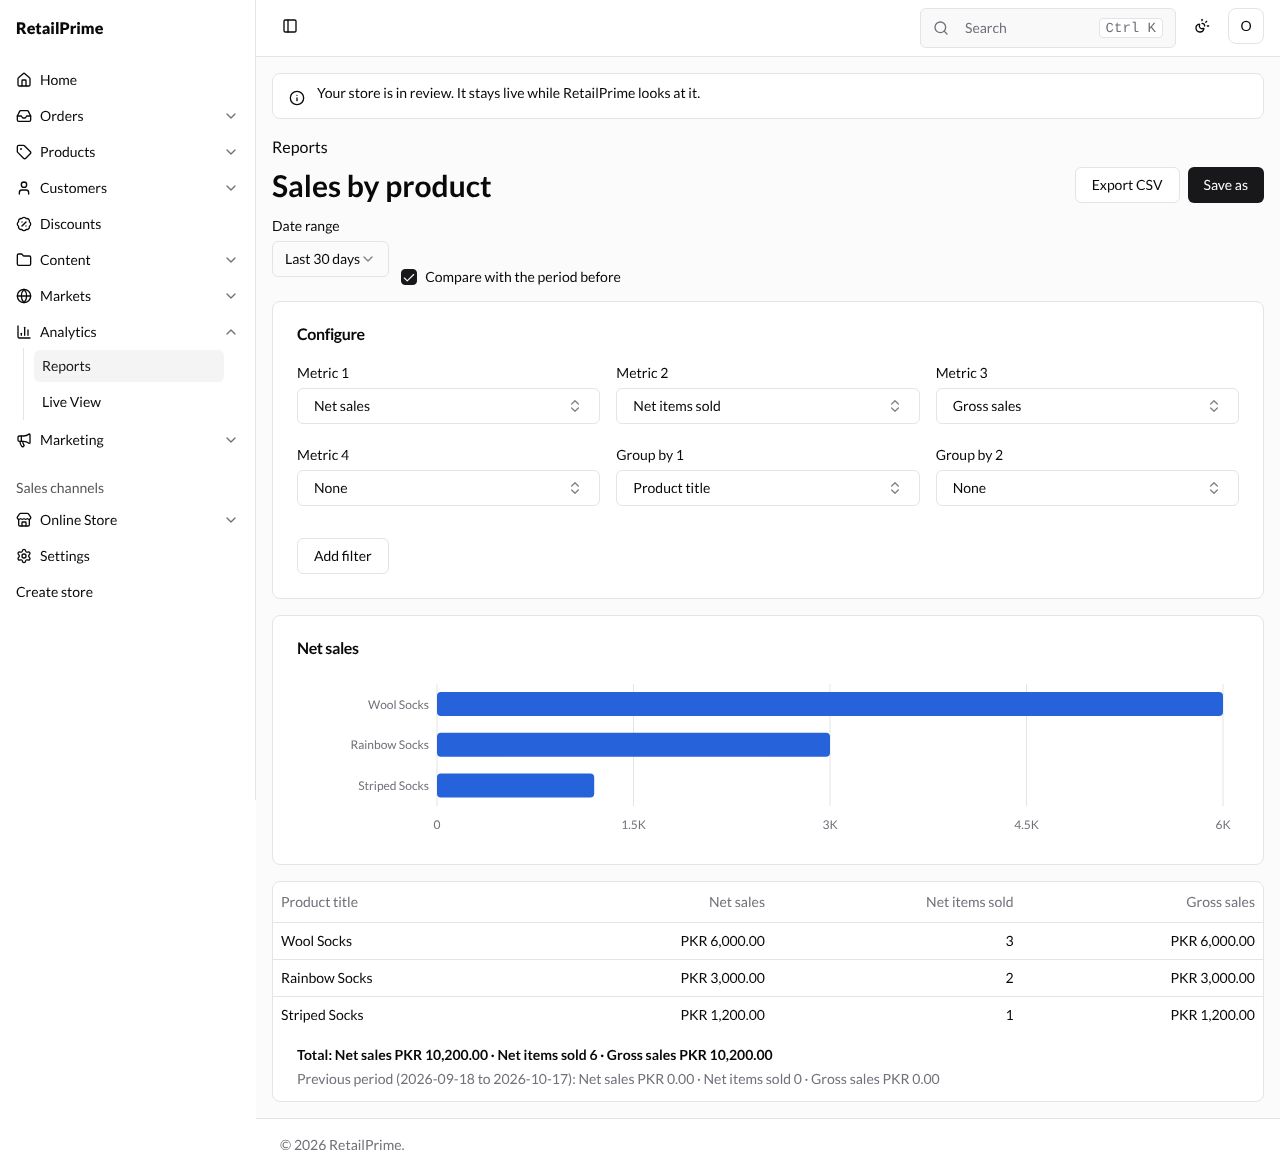
Press a report’s name, such as Sales by product. The report’s page has:
- Date range (the same choices as the overview) and Compare with the period before.
- Configure: the figures (Metric 1 to Metric 4), how rows are grouped (Group by 1 and Group by 2) and Add filter.
- A chart of the first metric.
- A table with a row for each group, a Total line under it and, when comparing, the Previous period totals.
Change a report
| Box | What it does | Example |
|---|---|---|
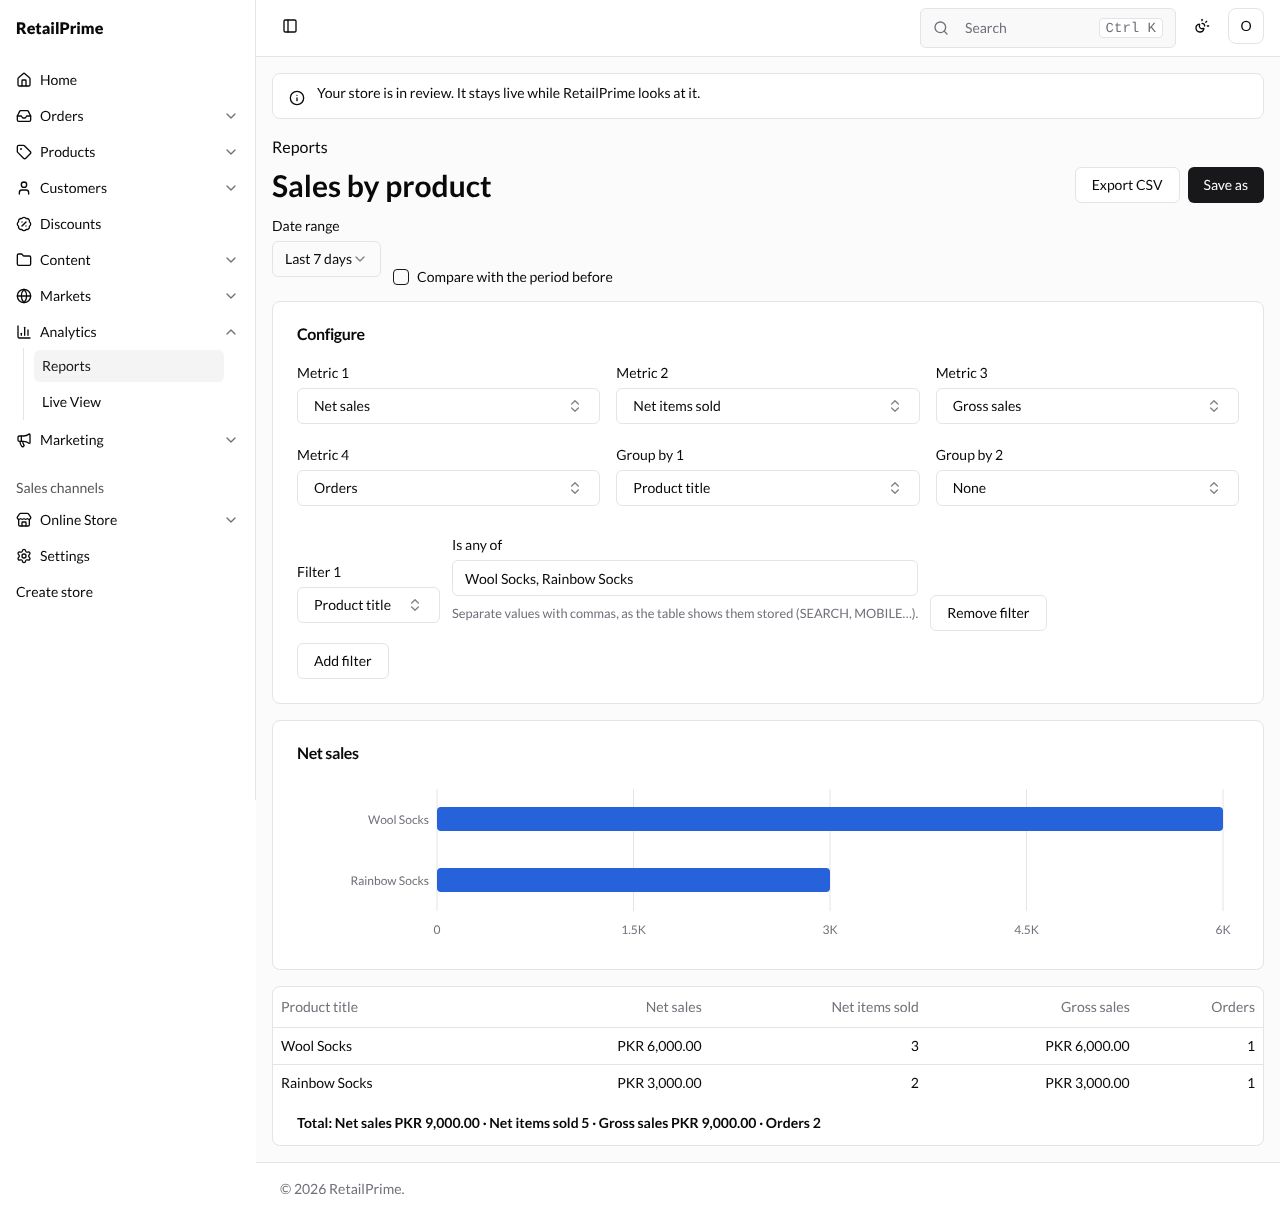
| Date range | The dates the report covers | Last 7 days |
| Compare with the period before | Untick it to leave out the previous period | unticked |
| Metric 1 to Metric 4 | The figures, as columns. None removes one | Metric 4: Orders |
| Group by 1, Group by 2 | What each row is, such as Product title or Day. Only groupings that fit the metrics are offered | Product title |
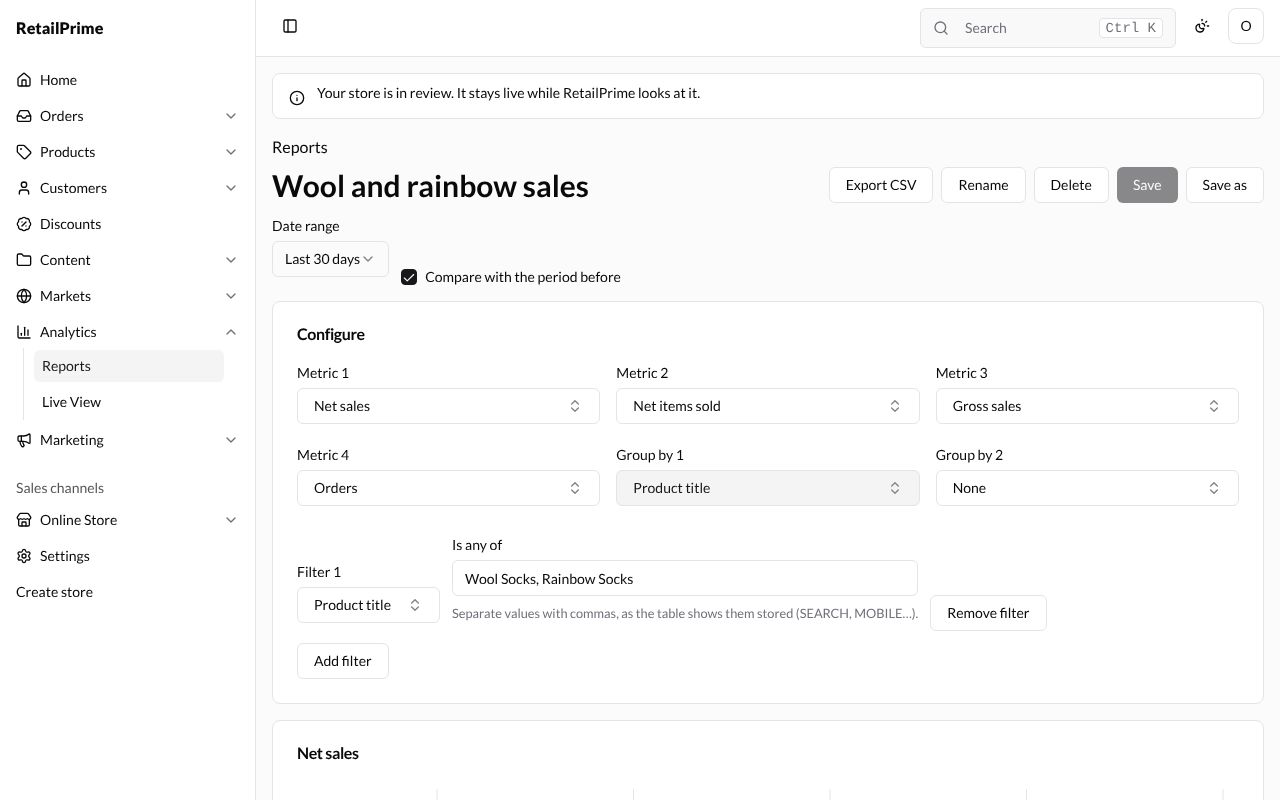
| Add filter | Adds Filter 1 (what to filter on) and Is any of (the values, separated by commas, as the table shows them stored). Press outside the box to apply it. Remove filter takes it off. Up to 3 filters | Product title is any of Wool Socks, Rainbow Socks |
The chart and table change straight away.
Some reports have a note under their chart that explains their figures, such as Fulfilment rate and Delivery times.
Export CSV
Press Export CSV at the top right. A CSV file with the report’s rows, for its dates, downloads.
Save a report of your own
-
Change a report, then press Save as.
-
Type a Report name, such as
Wool and rainbow sales, and press Save.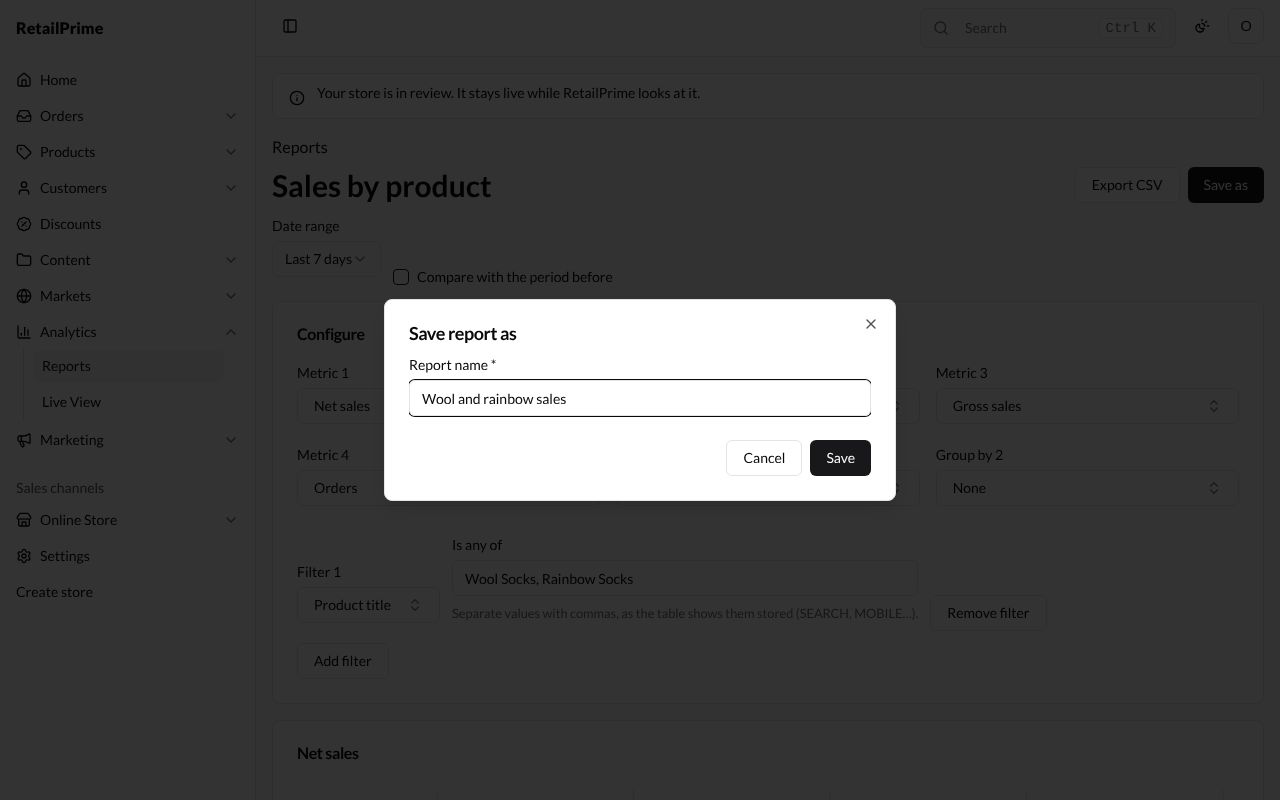
-
Your report opens. It has three more buttons: Rename, Delete and Save.
Change and save it
Change something, such as Group by 2: Product variant title. Save can now be pressed: press it. The page says Report saved.
Rename it
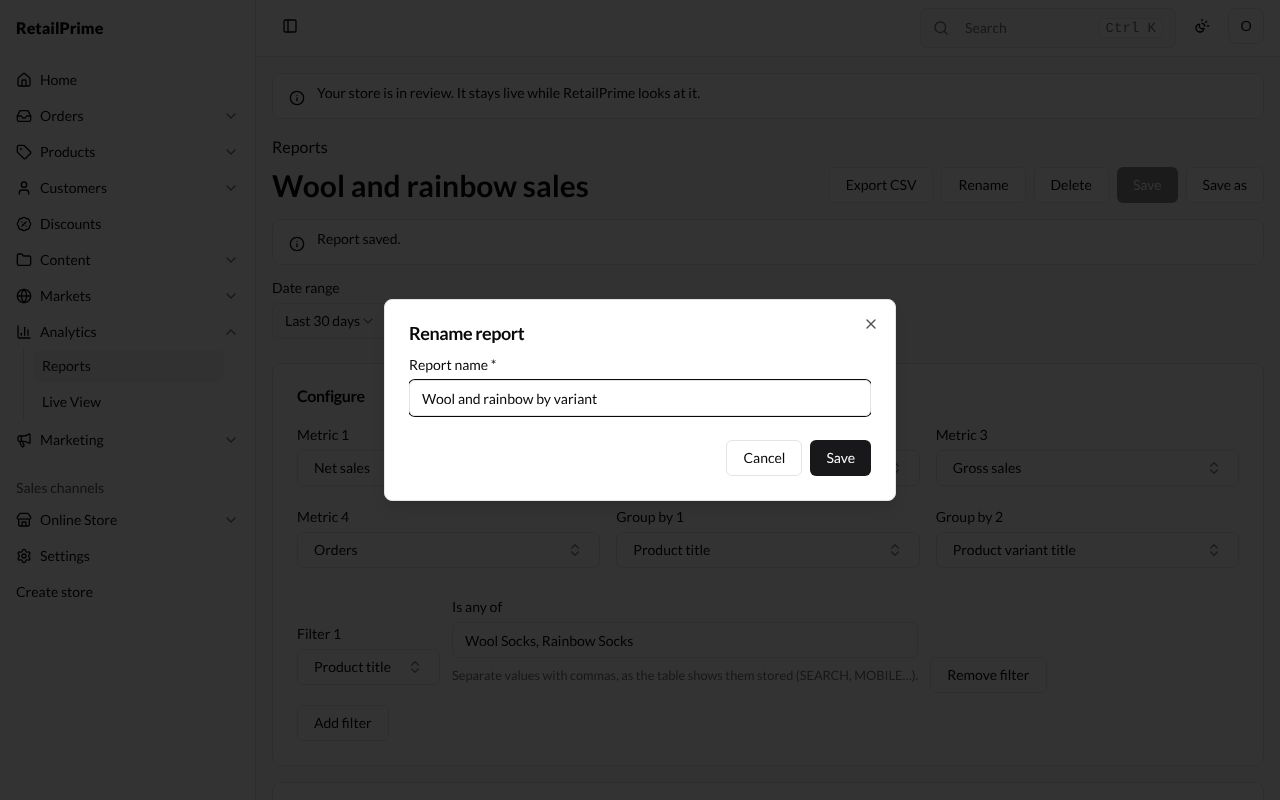
Press Rename, type the new Report name and press Save. The page says Report renamed.
Your saved reports are listed in Custom reports on the Reports page, for everyone in your store.
Delete it
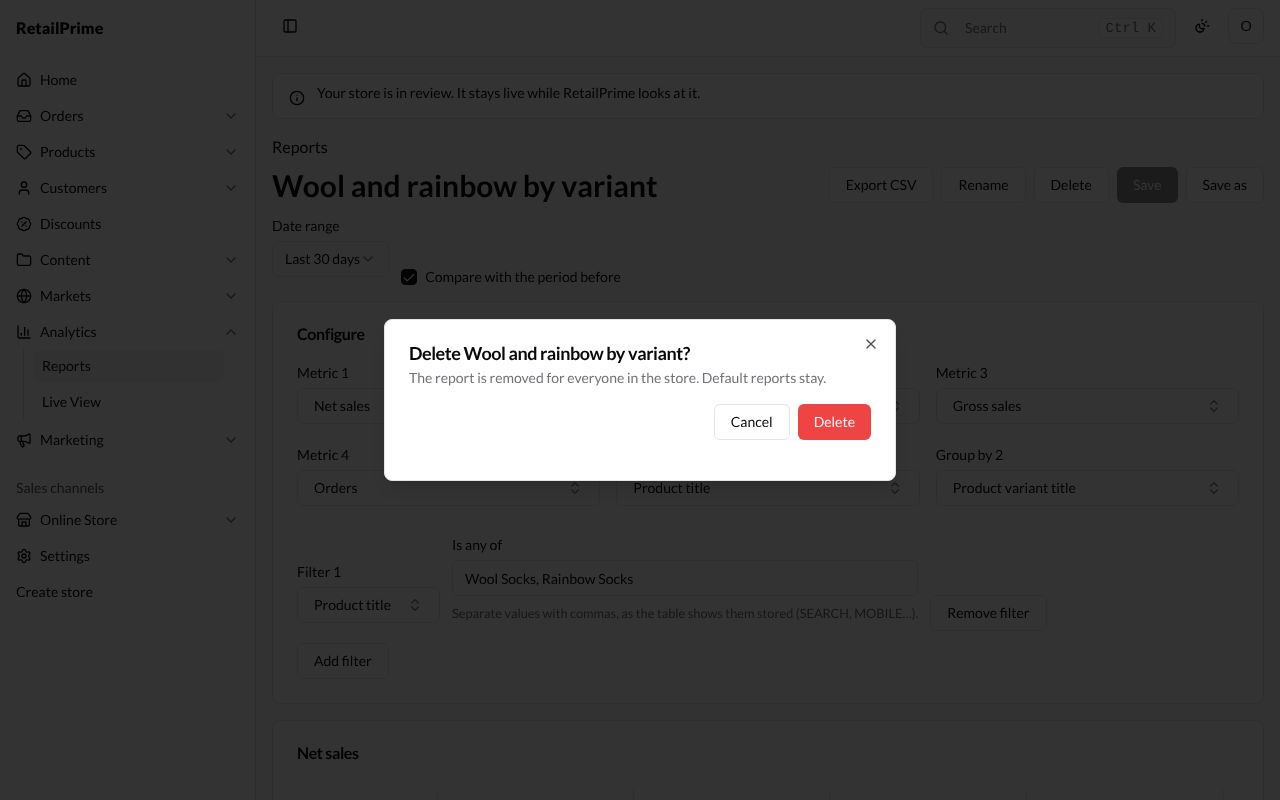
Open it and press Delete. A window asks Delete Wool and rainbow by variant? and says The report is removed for everyone in the store. Default reports stay. Press Delete. You are back on Reports.
Reports with their own layout
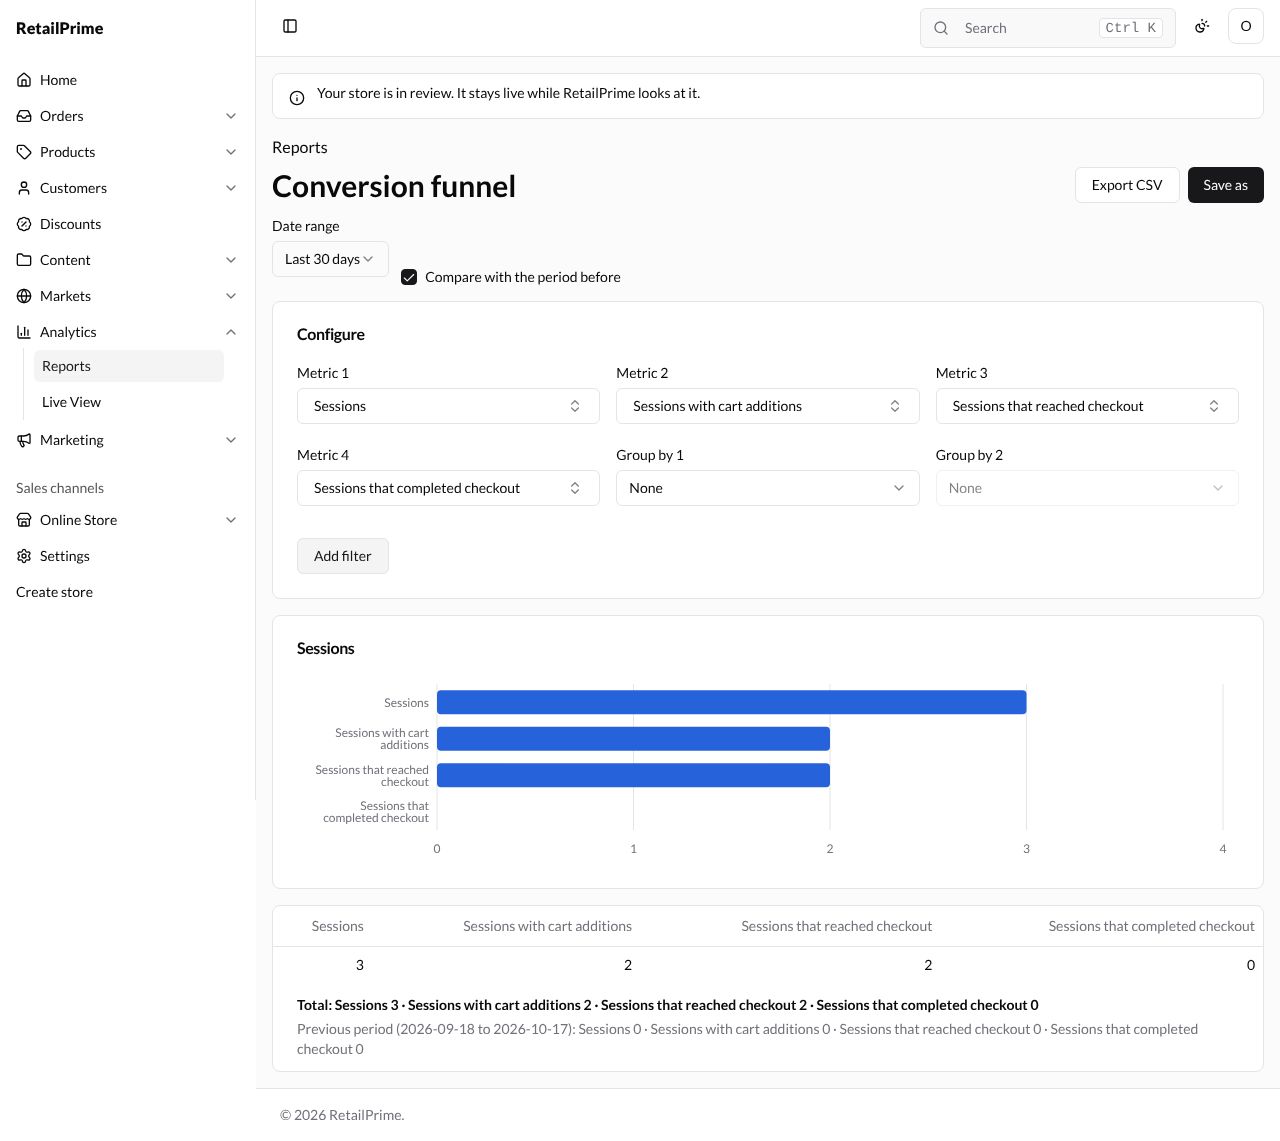
Conversion funnel
Without a Group by, a report shows one bar per metric. The Conversion funnel shows how many visits got to each step: Sessions, Sessions with cart additions, Sessions that reached checkout and Sessions that completed checkout.
Customer cohorts
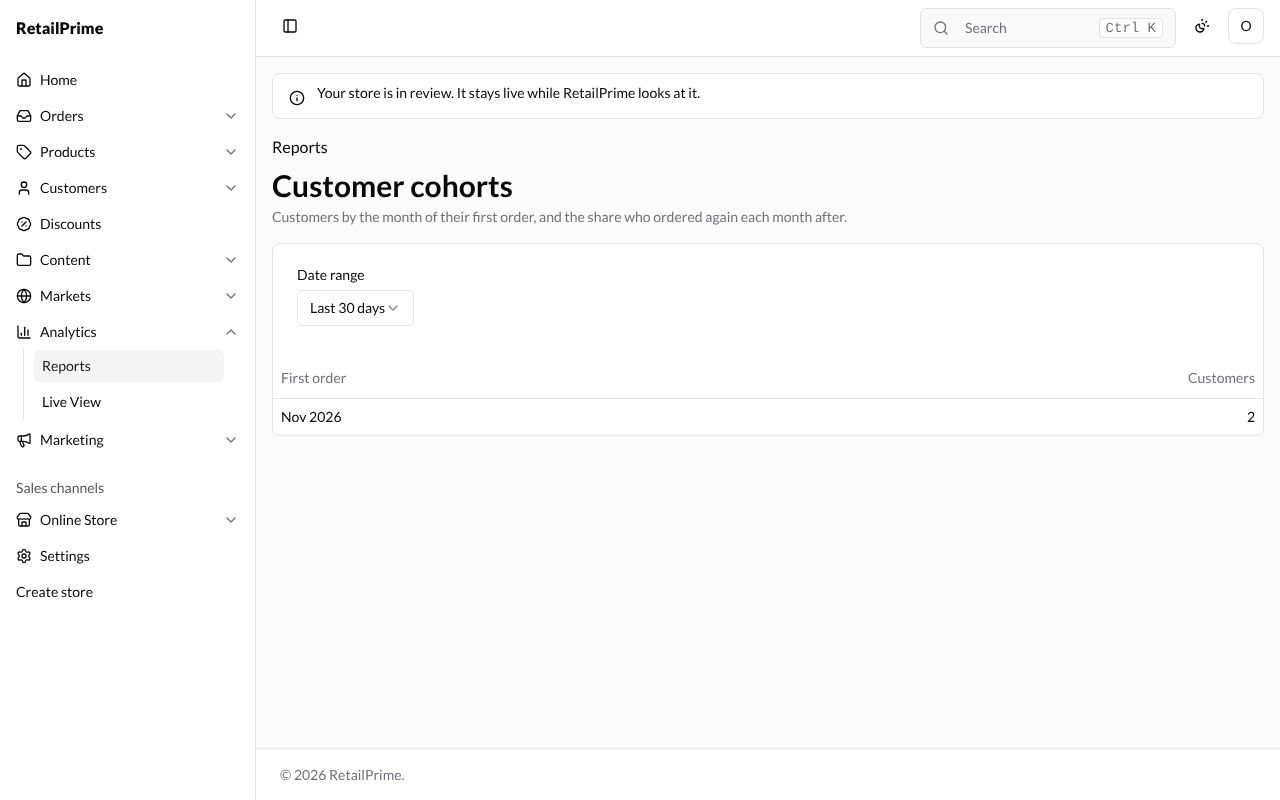
Customers by the month of their first order, and the share who ordered again each month after. Each row is a month (First order) with its Customers, then a column for each month after. It has a Date range only.
Demand forecast
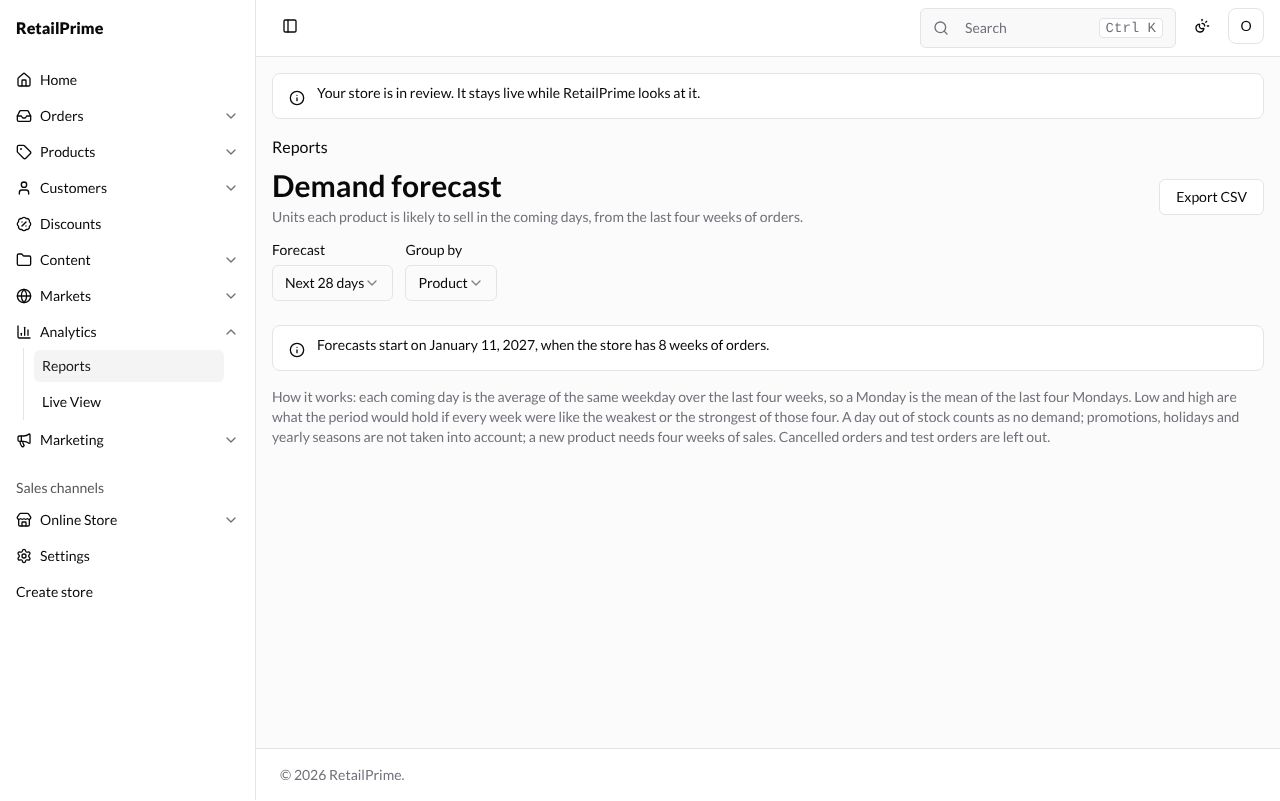
Units each product is likely to sell in the coming days, from the last four weeks of orders. Choose Forecast (how many days ahead: 7, 14 or 28) and Group by (Product or Variant), and press Export CSV to download it. A new store sees when forecasts start, such as Forecasts start on January 11, 2027, when the store has 8 weeks of orders. How it works explains the method.
What’s next
Live View: what is happening in your store right now.